P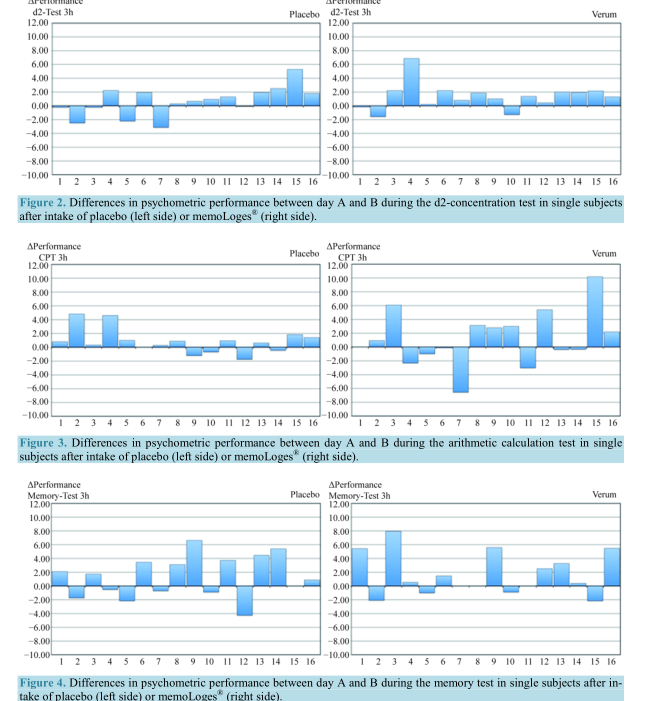 sychophysiological Effects of a
Combination of Sideritis and Bacopa Extract
(memoLoges ® ) in 32 Subjects Suffering from
Mild Cognitive Impairment. A Double-Blind,
Randomized, Placebo-Controlled, 2-Armed
Study with Parallel Design
Wilfried Dimpfel 1 , Andreas Biller 2 , Samir Suliman 3 , Gwladys N. Chiegoua Dipah 3
1 Justus-Liebig-University, Giessen, Germany
2 Dr. Loges + Co. GmbH, Winsen, Germany
3 NeuroCode AG, Wetzlar, Germany
Received 3 August 2016; accepted 9 September 2016; published 12 September 2016
Copyright © 2016 by authors and Scientific Research Publishing Inc.
This work is licensed under the Creative Commons Attribution International License (CC BY).
Abstract
Mild cognitive impairment (MCI) can be regarded as a non-demented transitional stage during the
development of Alzheimer’s disease. Early recognition of this stage might increase the chance of
prevention by early treatment. Within a pilot study, two plant-derived preparations and mixtures
thereof were tested successfully in subjects suffering from MCI. A combination of Sideritis scardica
and Bacopa monnieri extract (memoLoges ® ) was chosen now for a repetitive dosing during 4 weeks.
Thirty-two subjects aged 50 to 80 years and suffering from MCI (having a DemTect questionnaire
score between 8 and 13) were recruited for intake of 2 capsules of the preparation per day. Quan-
titative EEG recording during relaxation and concomitant performance of three 5 minutes last-
ing psychometric tests (d2-concentration test, arithmetic calculation test and memory test) was
achieved at the first day and one day after the last repetitive intake. Seventeen channels of EEG
and one channel EOG (for artefact rejection) were recorded. After frequency analysis (FFT) cur-
rent source density was calculated as reported earlier. One, two and three hours after intake of
the herbal extract or placebo the whole procedure was repeated. Brain imaging was achieved by
conversion of numerical values of spectral EEG power into spectral colors and additive color mix-
ture according to RGB as used in TV settings. Intake of memoLoges ® induced a trend of improve-
ment of performance in psychometric testing (all three tests). During relaxation quantitative as-
W. Dimpfel et al.
104
sessment of EEG data revealed attenuation of delta and theta spectral power in frontal brain as
likewise reported in the presence of the Alzheimer drug rivastigmine, bringing the spectrum back
to “normality”. During mental work memoLoges ® induced statistically significant increases of beta
power. Since MCI subjects produce less beta power in comparison to healthy subjects, this in-
crease must likewise be seen as a positive effect pointing to a healthier spectrum.
Keywords
Sideritis scardica, Bacopa monnieri, EEG Source Density, Spectral Power, Mild Cognitive
Impairment, memoLoges ® , Psychophysiology, CATEEM ®
1. Introduction
“Mild Cognitive Impairment (MCI) describes the cognitive state of non-demented individuals who report mem-
ory deficits, which should preferably be corroborated by an informant, and measurable by objective testing” [1].
Objective testing has been performed on two levels: performance of psychometric tests and concomitant record-
ing of quantitative EEG [2]. In this earlier publication, the d2-concentration test had turned out to be more sensi-
tive than an arithmetic calculation or memory test. Performance in this test correlated very well with the so-
called DemTect score, which was used as inclusion criterion. Others have also recorded quantitative EEG during
extensive neuropsychological testing in order to objectify brain dysfunction [3]. Successful identification of an
early EEG-based biomarker of mild cognitive impairment has also been claimed during the performance of an
attention task [4]. It has been stated in the literature, that the use of biomarker data can supplement clinical cha-
racterization and identification of MCI and dementia pathologies [5]. There is converging evidence, that MCI is
an early stage of Alzheimer’s disease preceding it for up to 10 years [6]. Objective measurement of such func-
tional disturbances might therefore open the possibility of an early treatment in order to prevent the progression
into Alzheimer’s disease, and it is also the precondition for proofing the efficacy of any treatment.
The present investigation aimed at such an option of early treatment. After successful characterization of a
new combination of extract from Sideritis scardica in combination with Bacopa extract within a single dose
clinical trial, there was a need for repetitive dosing during longer time. In this case, we decided to follow a daily
intake for 4 weeks. Main inclusion criterion was a score in the DemTect questionnaire between 8 and 13, which
has been validated to represent mild cognitive impairment [7].
2. Methods
2.1. Subjects
Twenty-eight male and four female subjects (average age: 58.63 ± 5.79 y) were recruited by advertisements in
newspapers. Thirty-two subjects-selected by the questionnaire “DemTect” [8] having a score between 8 and 13—
were included into the study. Within a parallel design they performed a daily intake of the herbal extract combi-
nation or placebo in a double-blind and randomized manner. Besides placebo they obtained two capsules con-
taining 120 mg Bacopa monnieri extract + 380 mg Sideritis scardica extract plus 20 mg of Vitamin B6, 500 µg
of Vitamin B12, 400 µg folic acid, 18 mg of Vitamin B5 and 1,5 mg Zinc as active ingredients per day for 4
weeks. Placebo capsules did not contain active ingredients, mainly cellulose (provided by Dr. Loges GmbH,
Winsen, Germany). The following inclusion criteria were followed: male or female subjects aged 50 to 80 years
suffering from mild cognitive impairment, giving informed consent, negative ethanol test. Exclusion criteria
consisted in:
Suffering from acute or chronic disease.
Intake of centrally acting medication.
Intolerability against herbal preparations.
Intake of unusual high amounts of coffee or nicotine.
Participation at another clinical study within the last 30 days.
Positive alcohol testing.
Intake of green tea, St. John’s wort, red rooibos tea, ginseng extract or ginkgo extract.
W. Dimpfel et al.
105
DemTect questionnaire score 14 or higher.
Revocation of informed consent.
The time line of experimental days is given in Figure 1.
2.2. EEG Recording
Basically, the method of quantitative EEG recording in combination with performance of psychometric chal-
lenges was followed as published [9]. EEG equipment was from MEWICON CATEEM-Tec. GmbH, Schwar-
zenberg am Böhmerwald, Austria. In short, three mental tests were performed concomitantly with the EEG re-
cording for 5 minutes: a d2-concentration test (d2-test), an arithmetic calculation test (CPT) and a memory-test
(ME). Seventeen channels of EEG and one channel EOG (for artifact rejection) were recorded. After frequency
analysis (FFT) current source density was calculated as reported earlier [10] [11]. Baseline values (µV 2 ) before
the administration were set to 100% for further data processing. One, two and three hours after intake of the
herbal extract or placebo the whole procedure was repeated. Results are given in % of this baseline values for
each measurement. Brain Imaging was achieved by conversion of numerical values of spectral EEG power into
spectral colors and additive color mixture according to RGB as used in TV settings and represent a true result of
the measurement [12]. The maps are constructed by nonlinear LaGrange interpolation and mathematically cor-
respond to a 64 channel EEG.
2.3. Statistics
Due to the parallel design of the study the non-parametric Wilcoxon test was applied to separate the effects of
memoLoges ® from placebo. In order to differentiate results with respect to effectiveness during relaxation or
performance of psychometric tests, data using all 102 parameters (data from 17 electrode positions times 6 fre-
quency ranges) were fed into linear discriminant analysis according to Fischer. Results from the first three dis-
criminant functions were depicted in space (x, y and z coordinates). Results from the 4 th to 6 th discriminant func-
tions were transformed into color according to the RGB mode (like in TV).
3. Results
3.1. Results of Psychometric Performance
As described under methods three psychometric tests were performed during the EEG recordings before and af-
ter intake of the 2 capsules. Performance was individually very heterogeneous. Results obtained during perfor-
mance of the d2-concentration test from single individuals 3 hours after intake are depicted in Figure 2. Clear
improvements within the placebo group were reached by 8 subjects, whereas in the active group 10 subjects
performed better after 4 weeks intake. During performance of the arithmetic calculation test 7 subjects in each
group showed improvements, however—on average—the active group showed higher improvements. Data from
single subjects are documented in Figure 3. A similar picture arose during performance of the memory test,
Figure 1. Time line of consecutive actions on the two experimental days at
the beginning and next day after 4 weeks of daily intake of trial preparations.
W. Dimpfel et al.
106
Figure 2. Differences in psychometric performance between day A and B during the d2-concentration test in single subjects
after intake of placebo (left side) or memoLoges ® (right side).
Figure 3. Differences in psychometric performance between day A and B during the arithmetic calculation test in single
subjects after intake of placebo (left side) or memoLoges ® (right side).
Figure 4. Differences in psychometric performance between day A and B during the memory test in single subjects after in-
take of placebo (left side) or memoLoges ® (right side).
where 8 subjects in the placebo group showed improved performance, 7 subjects in the active group, however
with stronger individual performance within these responders (Figure 4). Average performances are given in
Table 1. However, there was no statistically significant difference between the two groups.
3.2. Quantitative EEG Data
3.2.1. Spectral Frequency Power during Relaxation (Eyes Open)
Absolute spectral baseline power was comparable in both groups with respect to slow and middle frequencies at
W. Dimpfel et al.
107
Table 1. Comparison of psychometric performance between day A (beginning of intake) and day B (next day after 4 weeks
intake). Data are given as difference in mean score values (marked fat): Average values (AV) and standard deviation (SD) as
well as standard error of the mean (SEM). Statistically no significant differences between placebo and memoLoges ® were
detected. D2 = d2 concentration test; CPT = arithmetic calculation test; ME = memory test.
d2-Performance 3h Difference day B-A
Placebo Verum
AV 0.65 1.33
SD 2.11 1.89
SEM 1.58 1.24
CPT-Performance 3h Difference day B-A
Placebo Verum
AV 0.84 1.25
SD 1.78 3.96
SEM 1.20 3.00
ME-Performance 3h Difference day B-A
Placebo Verum
AV 1.32 1.65
SD 3.01 3.06
SEM 2.50 2.54
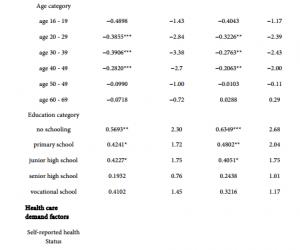
day A. However, there were some differences with respect to beta power. Alpha2, Beta1 and Beta2 power were
clearly higher in the placebo group after 4 weeks (p < 0.05 for all three frequencies, details in Table 2).
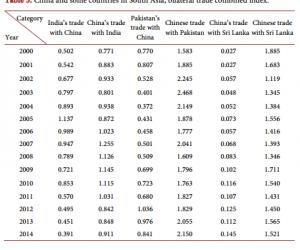
On day B after 4 weeks of daily intake of the preparations the differences between the placebo-group were
still present with respect to the fast frequencies. Data are documented in Table 3. These values are set to 100%
and serve for determination of the change of spectral power in the presence of either placebo or extracts.
Changes of spectral power will be documented in % of this baseline value.
3.2.2. Documentation of Neurophysiological Testing
The surface of the brain is anatomically divided into several regions, which are involved during performance of
different tasks. With regard to consciousness mainly the frontal brain seems to be involved, represented by elec-
trode positions F 3 , 4 , 7 , 8 . Electric circuits dealing with memory processes are located within the temporal lobe repre-
sented by electrode positions T 3 , 4 , 5 , 6 . Associative processes are found more in central and even more in parietal re-
gions represented by electrode positions C 3 , 4 and P 3 , 4 . According to this neuroanatomical features performance of
different psychometric tests leads to changes of the frequency pattern in various parts of the brain, which can be
defined as regions of interest (ROI). In order to document the effectiveness of the preparations spectral power dur-
ing baseline recording is set to 100% and changes in the presence of preparations are calculated as percent thereof.
Data were recorded during relaxation (with eyes open) and three task related conditions (under mental load).
Comparison between placebo and verum is performed for each electrode position separately and documented
as a bargraph. In addition, data from both groups are also depicted as source density color maps containing non-
linear interpolated data and thus corresponding mathematically to a 64 channel EEG. Since color coding repre-
sents a true result and not a so-called “false” color coding, resulting maps can be interpreted more clearly since
they represent linear changes and not a “staircase”.
3.3. Effectiveness of Memologes ® during Relaxation (Eyes Open) on Day A and B
The first condition for recording of the EEG consisted in a state of relaxation with open eyes before and after
intake of 2 capsules of placebo or verum. Results are calculated as spectral power in % of the baseline values
W. Dimpfel et al.
108
Table 2. Documentation of absolute spectral power values as median in µV 2 on day A. Starting values of absolute EEG
spectral power in relaxed condition with eyes open. Data are given in µV 2 for each electrode position and each frequency
range. Verum: 120 mg of Bacopa extract plus 380 mg of Sideritis extract. E = electrode position, Med = median over all
electrode positions.
Absolute Spectral Power during relaxation (eyes open) 0 h before acute intake at day A
Delta Theta Alpha1 Alpha2 Beta1 Beta2
Subjects n = 16 n = 16 n = 16 n = 16 n = 16 n = 16 n = 16 n = 16 n = 16 n = 16 n = 16 n = 16
Electrode Placebo Verum Placebo Verum Placebo Verum Placebo Verum Placebo Verum Placebo Verum
Cz 2.17 1.64 0.55 0.42 0.88 0.38 0.63 0.36 0.76 0.42 1.03 0.57
Fz 2.91 2.47 0.84 0.67 1.00 0.66 0.83 0.41 0.85 0.46 1.12 0.65
F3 2.71 2.59 0.82 0.69 0.87 0.69 0.79 0.65 1.20 0.97 2.67 1.63
C3 1.89 1.35 0.54 0.40 0.78 0.52 1.03 0.74 1.58 1.28 2.07 1.38
P3 1.55 0.90 0.38 0.25 0.65 0.32 0.60 0.37 0.76 0.60 0.56 0.46
Pz 1.75 1.44 0.44 0.36 0.78 0.56 0.64 0.50 0.57 0.62 0.50 0.46
P4 1.07 1.19 0.29 0.33 0.62 0.47 0.58 0.42 0.54 0.47 0.41 0.35
C4 1.84 1.49 0.42 0.39 0.96 0.43 1.14 0.65 1.60 0.74 1.38 0.83
F4 2.59 2.26 0.74 0.67 0.77 0.93 0.71 0.64 1.33 0.82 2.10 1.16
F7 8.47 8.37 1.60 1.45 1.82 1.83 1.73 1.24 2.93 1.81 4.55 2.93
T3 3.26 3.70 0.98 0.84 1.31 1.65 1.69 1.32 2.33 1.64 3.90 2.55
T5 2.85 2.32 0.99 0.94 1.84 1.33 1.38 1.00 1.66 1.37 1.62 1.18
O1 3.26 2.77 0.79 0.66 0.92 0.69 1.05 0.69 1.12 1.13 2.12 1.26
O2 3.38 3.20 0.73 0.68 0.99 0.82 1.48 0.82 1.72 0.92 1.60 1.11
T6 2.78 2.19 0.90 0.71 1.42 1.43 1.48 1.38 1.84 1.69 1.37 1.08
T4 3.11 3.22 0.83 0.77 1.52 1.40 1.54 1.31 2.75 1.42 2.76 1.98
F8 6.72 6.58 1.27 1.48 1.61 1.79 1.60 1.43 2.35 1.83 3.68 2.24
Med 2.61 2.29 0.64 0.69 0.85 0.86 0.99 0.76 1.35 0.97 1.80 1.11
Table 3. Documentation of absolute spectral power values as median in µV 2 on day B. Starting values of absolute EEG
spectral power in relaxed condition with eyes open. Data are given in µV 2 for each electrode position and each frequency
range. Verum: 120 mg of Bacopa extract plus 380 mg of Sideritis extract. E = electrode position, Med = median over all
electrode positions.
Absolute Spectral Power during relaxation (eyes open) 0 h after daily repetitive intake for 4 weeks
Delta Theta Alpha1 Alpha2 Beta1 Beta2
Subjects n = 16 n = 16 n = 16 n = 16 n = 16 n = 16 n = 16 n = 16 n = 16 n = 16 n = 16 n = 16
Electrode Placebo Verum Placebo Verum Placebo Verum Placebo Verum Placebo Verum Placebo Verum
Cz 2.02 1.46 0.63 0.43 1.04 0.66 0.84 0.50 1.15 0.59 1.21 0.70
Fz 2.54 2.66 0.70 0.78 1.01 0.92 1.05 0.49 0.99 0.55 1.74 0.67
F3 2.43 2.27 0.65 0.79 1.06 0.85 0.79 0.56 1.52 1.15 3.02 1.37
C3 1.45 1.59 0.42 0.42 0.93 0.68 1.20 0.83 1.60 1.35 2.04 1.39
P3 1.59 0.89 0.38 0.28 0.87 0.56 0.75 0.50 0.86 0.59 0.75 0.54
Pz 2.06 1.65 0.42 0.37 1.68 0.63 0.80 0.48 0.98 0.59 0.64 0.51
P4 1.63 1.03 0.39 0.38 0.97 0.50 0.58 0.46 0.73 0.45 0.54 0.37
C4 1.56 1.36 0.48 0.42 0.95 0.67 1.50 0.51 1.92 0.88 1.69 0.81
F4 2.10 2.01 0.65 0.75 0.80 0.94 0.98 0.53 1.59 0.74 3.14 1.21
F7 8.08 8.08 1.48 1.47 2.26 2.08 1.92 1.43 2.32 1.85 4.85 3.15
T3 3.52 4.38 0.89 1.03 2.55 2.36 2.09 1.62 2.78 2.05 3.39 2.80
T5 2.73 2.10 0.97 0.68 1.52 0.95 1.57 1.11 1.62 1.18 1.64 1.37
O1 3.17 2.21 0.73 0.60 0.92 0.76 1.27 0.67 1.47 1.18 2.56 1.31
O2 3.10 2.13 0.80 0.67 1.33 0.87 1.99 0.69 1.71 1.12 2.57 1.15
T6 2.91 2.27 0.86 0.80 1.27 1.75 1.78 1.23 2.22 1.46 1.48 1.02
T4 3.96 2.89 0.96 0.81 3.09 1.34 1.80 1.43 2.87 1.83 5.54 2.06
F8 7.48 6.45 1.38 1.27 2.28 1.42 1.99 1.19 2.95 1.79 4.83 2.28
Med 2.68 2.15 0.65 0.66 1.06 0.91 1.42 0.69 1.54 1.00 2.23 1.14
W. Dimpfel et al.
109
before intake and documented as bar graph and map. Main differences between placebo and memoLoges ® con-
sisted in an increase of alpha1 power within several brain regions. As documented in Figure 5(a) this increase
(yellow bars) was statistically significantly different from control in the presence of memoLoges ® . This change
of the frequency pattern is also seen as yellow spot in the map (Figure 5(b), upper image).
MemoLoges ® (2 capsules) was taken daily for 4 weeks before repetition of the measurements according to an
identical scheme one day thereafter. First recording condition was in the relaxed state with open eyes. Like ob-
served during the recording on day A again increases of alpha1 spectral power emerged, which–however–did
not reach wide statistical significance in comparison to control. Increases of beta power was seen mainly in
fronto-temporal areas. This led to a dominance of blue color in the map 3 hours after intake. Changes with re-
spect to all single electrode positions are depicted in Figure 5(a), lower image.
Documentation of the results with respect to three main regions of interest revealed time dependent effects
of memoLoges ® in comparison to control. Time lines of spectral changes are depicted in Figure 6 for frontal
brain (represented by electrode positions F 3 , 4 , 7 , 8) , temporal lobe (represented by electrode positions T 3 , 4 , 5 , 6)
and centro-parietal areas (represented by electrode positions C 3 , 4 and P 3 , 4) . Delta spectral power is attenuated
in all three regions of interest, whereas alpha1 spectral power has increased in the temporal lobe and centro-
parietally.
Regarding the time line of effectiveness after 4 weeks of daily intake significant attenuation of theta power in
the frontal lobe was observed like in the first recording, thus confirming this effect of memoLoges ® . Increase of
centro-parietal alpha1 and alpha2 power did not reach statistical significance compared to placebo. Also stable
increase of beta2 power likewise missed statistical significance. An overview on all time dependent changes is
depicted in Figure 7.
3.4. Effectiveness of memoLoges ® during Performance of the d2-Test on Day A and B
During performance of the d2-test a statistically highly significant attenuation of the spectral power within the
centro-parietal region was observed in the presence of memoLoges ® on the first day of intake. This was also
observed in the temporal lobe (electrode position T 6 ).
In addition, a tendency of higher spectral power in the delta range was observed on the first day, whereas at-
tenuation was seen with respect to theta and alpha1 spectral power in the presence of memoLoges ® . This attenu-
ation became statistically significant only during the 3 rd hour after intake (Figure 8(a)). In the parietal lobe a sta-
tistically highly significant attenuation with respect to all frequencies. Alpha2 waves were also attenuated in the
frontal lobe and temporal lobe during the first 2 hours.
After 4 weeks of daily intake performance of the d2-test led to enhanced delta activity in the frontal brain and
also within the left temporal lobe (electrode position T 5 ). In centro-parietal areas reduction of alpha waves was
observed, which partially reached statistical significance. Regarding the maps no clear difference between me-
moLoges ® and placebo was recognized. Effects on single areas (electrode positions) are documented in Figure 9.
Regarding time dependent effectiveness during performance of the d2-test a highly significant increase of
delta power was observed in the temporal lobe during the 1 st and 2 nd hour after intake, in the frontal lobe only
during the 1 st hour. However, opposite to the first recording at the beginning of the experiment beta power was
attenuated to a significant degree. Details are given in Figure 9. Regarding the time line of effectiveness after 4
weeks of daily intake statistically significant attenuation of beta spectral power was observed in centro-parietal
brain regions in comparison to placebo (Figure 10).
3.5. Effectiveness of memoLoges ® during Performance of the Arithmetic Calculation Test
on Day A and B
During performance of the arithmetic calculation test a general increase of spectral beta power was observed.
This led to a predominance of blue color within the map as documented in Figure 11. However no statistical
significance emerged.
Furthermore, in the centro-parietal region a significant decrease of theta power was observed. In the temporal
lobe a statistically significant increase of alpha2, beta1 and beta2 spectral power was seen. An overview on
changes during performance of this test is given in Figure 12.
Performance of the arithmetic calculation test after 4 weeks of daily intake of memoLoges ® or placebo no
major differences were recognized between the two preparations except for some attenuation of alpha activity.
Maps also differed only slightly. Details can be taken from Figure 12.
W. Dimpfel et al.
110
Figure 5. Documentation of the effect of memoLoges ® in comparison to placebo during relaxation (eyes open) as change
in % of the baseline spectral power during the 3 rd hour after intake. Changes of spectral power are documented for each elec-
trode position: C = central, F = frontal, P = parietal, T = temporal and O = occipital. Frequency windows are coded into col-
ors: red = delta, orange = theta, yellow = alpha1, green = alpha2, turquoise = beta1 and blue = beta2. Statistical probabilities
according to non-parametric Wilcoxon tests are marked by stars: * =p < 0.1; ** =p < 0.05; *** =p < 0.01. Maps were constructed
by coding single frequencies into spectral colors and additive color mixture according to the so-called RGB mode (like in
television). Acute data: upper image; repetitive data: lower image.
(a)
(b)
W. Dimpfel et al.
111
Figure 6. Time line of the effectiveness of memoLoges ® (red line) in comparison to control (blue line) in three regions of
interest under the recording condition “eyes open” (day A). Changes are given in % of the baseline recording on the ordinate.
Time after intake (day A) is given on the abscissa. Statistical probabilities according to non-parametric Wilcoxon tests are
marked by stars: * =p < 0.1; ** =p < 0.05; *** =p < 0.01.
W. Dimpfel et al.
112
Figure 7. Time line of the effectiveness of memoLoges ® (red line) in comparison to control (blue line) in three regions of
interest during relaxed state with open eyes after 4 weeks of daily intake. Changes are given in % of the baseline recording
on the ordinate. Time after intake is given on the abscissa. Statistical probabilities according to non-parametric Wilcoxon
tests are marked by stars: * =p < 0.1; ** =p < 0.05; *** =p < 0.01.
W. Dimpfel et al.
113
Figure 8. Documentation of the effect of memoLoges ® in comparison to placebo during performance of the d2-test as
change in % of the baseline spectral power during the 3 rd hour after intake. Changes of spectral power are documented for
each electrode position: C = central, F = frontal, P = parietal, T = temporal and O = occipital. Frequency windows are coded
into colors: red = delta, orange = theta, yellow = alpha1, green = alpha2, turquoise = beta1 and blue = beta2. Statistical
probabilities according to non-parametric Wilcoxon tests are marked by stars: * =p < 0.1; ** =p < 0.05; *** =p < 0.01. Maps
were constructed by coding single frequencies into spectral colors and additive color mixture according to the so-called RGB
mode (like in television). Acute effects: upper image; repetitive effects: lower image.
(a)
(b)
W. Dimpfel et al.
114
Figure 9. Time line of the effectiveness of memoLoges ® (red line) in comparison to control (blue line) in three regions
of interest during performance of the d2-test (day A). Changes are given in % of the baseline recording on the ordinate.
Time after intake is given on the abscissa. Statistical probabilities according to non-parametric Wilcoxon tests are
marked by stars: * =p < 0.1; ** =p < 0.05; *** =p < 0.01.
W. Dimpfel et al.
115
Figure 10. Time line of the effectiveness of memoLoges ® (red line) in comparison to control (blue line) in three regions
of interest during performance of the d2-test after 4 weeks of daily intake. Changes are given in % of the baseline re-
cording on the ordinate. Time after intake is given on the abscissa. Statistical probabilities according to non-parametric
Wilcoxon tests are marked by stars: * =p < 0.1; ** =p < 0.05; *** =p < 0.01.
W. Dimpfel et al.
116
Figure 11. Documentation of the effect of memoLoges ® in comparison to placebo during performance of the arithmetic cal-
culation test (CPT) as change in % of the baseline spectral power during the 3 rd hour after intake. Changes of spectral power
are documented for each electrode position: C = central, F = frontal, P = parietal, T = temporal and O = occipital. Frequency
windows are coded into colors: red = delta, orange = theta, yellow = alpha1, green = alpha2, turquoise = beta1 and blue =
beta2. Statistical probabilities according to non-parametric Wilcoxon tests are marked by stars: * =p < 0.1; ** =p < 0.05; *** =p
< 0.01. Maps were constructed by coding single frequencies into spectral colors and additive color mixture according to the
so-called RGB mode (like in television). Acute effects: upper image; repetitive effects: lower image.
(a)
(b)
W. Dimpfel et al.
117
Figure 12. Time line of the effectiveness of memoLoges ® (red line) in comparison to control (blue line) in three re-
gions of interest during performance of the arithmetic calculation test (day A). Changes are given in % of the baseline
recording on the ordinate. Time after intake is given on the abscissa. Statistical probabilities according to non-parame-
tric Wilcoxon tests are marked by stars: * =p < 0.1; ** =p < 0.05; *** =p < 0.01.
W. Dimpfel et al.
118
Figure 13. Time line of the effectiveness of memoLoges ® (red line) in comparison to control (blue line) in three re-
gions of interest during performance of the arithmetic calculation test after 4 weeks of daily intake. Changes are given
in % of the baseline recording on the ordinate. Time after intake is given on the abscissa. Statistical probabilities ac-
cording to non-parametric Wilcoxon tests are marked by stars: * =p < 0.1; ** =p < 0.05; *** =p < 0.01.
W. Dimpfel et al.
119
Figure 14. Documentation of the effect of memoLoges ® in comparison to placebo during performance of the Memory test
(ME) as change in % of the baseline spectral power during the 3 rd hour after intake. Changes of spectral power are docu-
mented for each electrode position: C = central, F = frontal, P = parietal, T = temporal and O = occipital. Frequency windows
are coded into colors: red = delta, orange = theta, yellow = alpha1, green = alpha2, turquoise = beta1 and blue = beta2. Sta-
tistical probabilities according to non-parametric Wilcoxon tests are marked by stars: * =p < 0.1; ** =p < 0.05; *** =p < 0.01.
Maps were constructed by coding single frequencies into spectral colors and additive color mixture according to the so-
called RGB mode (like in television). Acute effects: upper image; repetitive effects: lower image.
(a)
(b)
W. Dimpfel et al.
120
Figure 15. Time line of the effectiveness of memoLoges ® (red line) in comparison to control (blue line) in three regions
of interest during performance of the memory test (day A). Changes are given in % of the baseline recording on the or-
dinate. Time after intake is given on the abscissa. Statistical probabilities according to non-parametric Wilcoxon tests
are marked by stars: * =p < 0.1; ** =p < 0.05; *** =p < 0.01.
W. Dimpfel et al.
121
Figure 16. Time line of the effectiveness of memoLoges ® (red line) in comparison to control (blue line) in three re-
gions of interest during performance of the memory-test after 4 weeks of daily intake. Changes are given in % of the
baseline recording on the ordinate. Time after intake is given on the abscissa. Statistical probabilities according to
non-parametric Wilcoxon tests are marked by stars: * =p < 0.1; ** =p < 0.05; *** =p < 0.01.
W. Dimpfel et al.
122
Regarding the time line of effectiveness after 4 weeks daily intake only some but constant increase of beta
power in the temporal lobe were seen. An overview on all data is given in Figure 13.
3.6. Effectiveness of memoLoges ® during Performance of the Memory Test on Day A
Performance of the memory test induced—similar to the arithmetic calculation test-increases of spectral beta
power predominantly in the frontal and temporal lobe in a statistically significant manner. In the parietal lobe
statistically significant attenuation occurred, whereas in the mid-frontal area an increase of theta power reached
statistical significance. Details are given in Figure 14. With respect to the map this led to predominant blue color.
After 4 weeks of daily intake of the preparations performance of the memory test induced a significant in-
crease of beta waves within the frontal brain. Maps calculated for the third hour after intake differed only
slightly showing a little bit more blue coloring. Details are given in Figure 15.
Regarding the time line strongest increases of beta1 and beta2 power were observed only in the frontal and
temporal lobe, absolutely not in the centro-parietal region. This increase became statistically significant during
the 3 rd hour after intake. However, in the centro-parietal area less of theta power was produced in comparison to
control. An overview on time dependent effects is given in Figure 15.
The increase beta activity in the frontal brain, which became statistically significantly different from control
during the third hour after intake had also been seen during the original recording at the beginning of the expe-
riment. An overview is given in Figure 16.
3.7. Results from Discrimination Analysis
In order to use all information provided by quantitative EEG analysis all 102 parameters (17 electrode positions
times 6 frequency ranges) were fed into discriminant analysis according to Fischer. Results from the first three dis-
criminant functions are projected using the x, y and z coordinates. Results from the 4 th to 6 th function are coded using
additive color mixture according the RGB (red-green-blue) mode like in TV. As documented in Figure 17 results
from the 4 different recording conditions are very well separated from each other. In addition, the effect of memo-
Loges ® is also very well separated from placebo data. Thus, discriminant analysis is well suited to show statistically
the overall effect of memoLoges ® in comparison to placebo in subjects suffering from mild cognitive impairment.
3.8. Safety
For safety reasons ECG and pulse were recorded at each measurement period. No deviations from normality
were recognized. MemoLoges ® was tolerated very well by all subjects without any side effect.
4. Discussion
Interpretation of EEG data depends on the recording condition. One discriminates between recording in the re-
laxed state (eyes open or closed) or during performance of mental challenges. In the relaxed state it has been
shown earlier that subjects suffering from mild cognitive impairment have higher delta and theta spectral power
in the frontal brain [2]. This higher spectral power of these slow waves prevents further increases during mental
performance due to a ceiling effect (during performance of psychometric tests massive increases of focal delta
and theta power were observed in healthy subjects [13]. Attenuation of these waves during relaxation as ob-
served in the presence of memoLoges ® in comparison to placebo can therefore be regarded as a positive effect,
since it allows for stronger increases during mental loads. This result is in line with data reported with respect to
the efficacy of rivastigmine in Alzheimer disease. Spectral analysis of EEG data showed a significant power de-
crease in the delta and theta frequency bands, i.e. a shift of the power spectrum towards “normalization” [14].
Concomitantly, alpha1 spectral power had increased in the presence of memoLoges ® during relaxation. This in-
dicates a higher degree of relaxation as reported earlier [9].
Interpretation of EEG data during audio-visual challenges is completely different as has been shown recently
[15]. Dependent on the type of mental challenge different brain areas react in a different manner with respect to
frequency changes. During psychometric performance increases of delta and theta power were observed in fron-
tal and temporal brain regions, whereas central regions showed attenuation of alpha waves in healthy subjects.
In subjects suffering from mild cognitive impairment more spectral slow wave power was produced in the pres-
ence of memoLoges ® during performance of the d2-test, because basic spectral power in these frequencies dur-
ing relaxation had been lowered and by it allowing more production of slow waves during the mental challenge.
W. Dimpfel et al.
123
Figure 17. Result of discriminant analysis 3 hours after intake of memoLoges ® . Projection of the result of the first three dis-
criminant functions is achieved using the x, y and z coordinates. Result from the 4 th to 6 th function is coded using additive
color mixture according the RGB (red-green-blue) mode like in TV. Data from the day A are depicted. A = day A, Ve = Ve-
rum, Pl = Placebo. EO = Eyes open; d2 = d2-test; CPT = arithmetic calculation test; ME = Memory test. Please note: not on-
ly different recording conditions but also effects of memoLoges ® and placebo are well discriminated from each other.
Concomitantly, memoLoges ® induced a highly statistically significant attenuation of alpha waves in the cen-
tro-parietal region. This additional decrease of alpha waves during performance of the d2-test in the presence of
memoLoges ® indicates a recovery, because central attenuation of alpha waves is an important feature during
mental performance [15]. Exactly this was also observed in this study during performance of the arithmetic cal-
culation test in the presence of memoLoges ® .
Coming back to the frontal and temporal areas, the damage of temporo-frontal area of the brain has been
shown to result in retrograde memory deficits [16]. Furthermore, it has been shown, that mental challenges in-
duce higher spectral power in the beta range. However, subjects suffering from mild cognitive impairment pro-
duced clearly less beta power during for example the d2-test [2]. Therefore, the statistically significant increase
of beta power as observed in the presence of memoLoges ® in comparison to placebo in this study during mental
performance (arithmetic calculation test and memory test) must be regarded as a sign of restoration to normal
functioning.
Beta1 waves are under the control of glutamate as shown in humans by a correlation in the presence of dif-
ferent dosages of a glutamate agonist [9]. The statistically significant effects of memoLoges ® therefore point to
an involvement of this transmitter with respect to the mechanism of action. An in vitro analysis of the major in-
gredient of memoLoges ® , namely an extract of Sideritis scardica, revealed an increase of long term potentiation,
which is related to time and space dependent memory. Data (to be published) showed the involvement of the
AMPA receptor mediated electric activity. These data corroborate the view that memoLoges ® acts via a gluta-
matergic mechanism as indicated by changes in spectral beta activity.
After repetitive dosing a similar picture of frequency changes emerged. Acute dosing one day after the 4
W. Dimpfel et al.
124
weeks intake revealed again attenuation of delta power during relaxation and increase during performance of the
d2-test as well as an increase of beta1 power in frontal and temporal brain during performance of the arithmetic
calculation test. Beta power also increased in frontal brain during the memory test. Generally, the effects were
somewhat weaker, possibly indicating a return to more normal brain functioning. Results of an earlier pilot
study with Sideritis scardica and Bacopa monnieri extracts in the presence of single dosages were confirmed
[17].
5. Conclusion
Intake of memoLoges ® induced a trend of improvement of performance in psychometric testing (all three tests)
in subjects suffering from mild cognitive impairment. Quantitative assessment of EEG data revealed attenuation
of delta and theta spectral power in frontal brain as likewise observed in the presence of the Alzheimer drug ri-
vastigmine, bringing the spectrum back to “normality”. Since MCI subjects produce less beta power in compar-
ison to healthy subjects, significant increases of beta power in the presence of memoLoges ® must likewise be
seen as a positive effect. Data are in line with a recent discovery, that Sideritis extract as the main ingredient in
memoLoges ® induced an increase of long term potentiation in the hippocampus slice preparation, which is re-
lated to time and space dependent memory.
Acknowledgements
Mrs. Ingrid K. Keplinger-Dimpfel is thanked for performance of the logistics of the study and quality control.
We greatly appreciate the experimental work as well as the data documentation performed by Mrs. Leonie
Schombert. Dr. Birgit Goyvaerts is greatfully acknowledged for critical review of the manuscript.
References
[1] Forlenza, O.V., Diniz, B.S., Stella, F., Texeira, A. and Gattaz, W.F., (2013) Mild Cognitive Impairment (Part 1): Clin-
ical Characteristics and Predictors of Dementia. Revista Brasileira de Psiquiatria, 35, 178-185.
http://dx.doi.org/10.1590/1516-4446-2012-3503
[2] Dimpfel, W. (2014) Neurophysiologial Biomarker of Mild Cognitive Impairment. Advances in Alzheimer’s Disease, 3,
64-77. http://dx.doi.org/10.4236/aad.2014.32008
[3] Corradini, P.L. and Persinger, M.A. (2015) Replace Psychometric Inferences with Direct Brain Measurements:
LORETA Reflects Traditional Cerebral Loci for Neuropsychological Tests. Neuroscience & Medicine, 6, 107-115.
http://dx.doi.org/10.4236/nm.2015.63018
[4] Caravaglios, G., Muscoso, E.G., Di Maria, G. and Costanzo, E. (2015) Patients with Mild Cognitive Impairment Have
Abnormal Upper-Alpha Event-Related Desynchronization/Synchronization (ERD/ERS) during a Task of Temporal
Attention. Journal of Neural Transmission, 122, 441-453. http://dx.doi.org/10.1007/s00702-014-1262-7
[5] Cedarbaum, J.M., Crans, G. and Grundman, M. (2010) Seeing with New Eyes: Finding a Path to Early Intervention
Trials in Alzheimer’s Disease. The Journal of Nutrition Health and Aging, 14, 306-309.
http://dx.doi.org/10.1007/s12603-010-0069-y
[6] Almkvist, O., Basun, H., Bäckmann, L., Herlitz, A., Lanfelt, L., Small, B., Viitanen, M., Wahlund, M.O. and Winblad,
B. (1998) Mild Cognitive Impairment—An Early Stage of Alzheimer’s Disease? Journal of Neural Transmis-
sion/Supplementum, 54, 21-29. http://dx.doi.org/10.1007/978-3-7091-7508-8_3
[7] Kalbe, E., Kessler, J., Calabrese, P., Smith, R., Passmore, A.P., Brand, M. and Bullock, R. (2004) DemTect: A New,
Sensitive Cognitive Screening Test to Support the Diagnosis of Mild Cognitive Impairment and Early Dementia. In-
ternational Journal of Geriatric Psychiatry, 19, 136-143. http://dx.doi.org/10.1002/gps.1042
[8] Kessler, J., Calabrese, P., Kalbe, E. and Berger. F. (2000) DemTect. Ein neues Screening-Verfahren zur Unterstützung
der Demenzdiagnostik. Psycho, 26, 343-347.
[9] Dimpfel, W., Koch, K. and Weiss, G. (2011) Early Effect of NEURAPAS ® Balance on Current Source Density (CSD)
of Human EEG. BMC Psychiatry, 11, 123-138. http://dx.doi.org/10.1186/1471-244X-11-123
[10] Harmony, T., Fernandez-Bouzas, A., Marosi, E., Fernandez, T., Bernal, J., Rodriguez, M., Reyes, A., Silva, J., Alonso,
M. and Casian, G. (1993) Correlation between Computed Tomography and Voltage and Current Source Density Spec-
tral. Parameters in Patients with Brain Lesions. Electroencephalography and Clinical Neurophysiology, 87, 196-205.
http://dx.doi.org/10.1016/0013-4694(93)90019-R
[11] Dimpfel, W., Hofmann, H.C., Prohaska. A., Schober, F. and Schellenberg, R. (1996) Source Density Analysis of Func-
tional Topographical EEG: Monitoring of Cognitive Drug Action. European Journal of Medical Research, 1, 283-290.
W. Dimpfel et al.
125
[12] Dimpfel, W. (2015) Drug Discovery and Translational Medicine Based on Neurophysiological Techniques. A holistic
Approach to Saving Animals. Books on Demand, Norderstedt.
[13] Schober, F., Schellenberg, R. and Dimpfel, W. (1995) Reflection of Mental Exercise in the Dynamic Quantitative To-
pographical EEG. Neurobiology, 31, 98-112.
[14] Gianotty, L.R., Künig, G., Faber, P.L., Lehmann, D., Pascual-Marqui, R.D., Kochi, K. and Schreiter-Gasser, U. (2008)
Rivastigmine Effects on EEG Spectra and Three-Dimensional LORETA Functional Imaging in Alzheimer’s Disease.
Psychopharmacology, 198, 323-332. http://dx.doi.org/10.1007/s00213-008-1111-1
[15] Dimpfel, W., ChiegouaDipah, G.N. and Gericke, N. (2016) EnkephaloVision: Anatomical Functionality Indicated by
Ultrashort Transient Regional EEG Spectral Power Changes during Cognitive and Emotional Challenges. World Jour-
nal of Neuroscience, 6, 90-110. http://dx.doi.org/10.4236/wjns.2016.62012
[16] Kroll, N.E.A., Markowwitsch, H.J., Knight, R.T. and Cramon, D.Y. (1997) Retrieval of Old Memories: The Temporo-
frontal Hypothesis. Brain, 120, 1377-1399. http://dx.doi.org/10.1093/brain/120.8.1377
[17] Dimpfel, W., Schombert, L. and Biller, A. (2016) Psychophysiological Effects of Sideritis and Bacopa Extract and
Three Combinations Thereof—A Quantitative EEG Study in Subjects Suffering from Mild Cognitive Impairment
(MCI). Advances in Alzheimer’s Disease, 5, 1-22. http://dx.doi.org/10.4236/aad.2016.51001
Submit or recommend next manuscript to SCIRP and we will provide best service for you:
Accepting pre-submission inquiries through Email, Facebook, LinkedIn, Twitter, etc.
A wide selection of journals (inclusive of 9 subjects, more than 200 journals)
Providing 24-hour high-quality service
User-friendly online submission system
Fair and swift peer-review system
Efficient typesetting and proofreading procedure
Display of the result of downloads and visits, as well as the number of cited articles


论文发表 是一个专门从事期刊推广、论文发表、论文发表辅导的机构。融合收集数百家期刊杂志社征稿评职称,发表论文,以供广大作者免费阅览,以期待各位作者在短时间内掌握每种期刊征稿要求、审稿范围,在日常繁重的工作中短时间开心、放心快速投稿、在适合的时间拿到刊物,评上职称,不为挤不上评职称的末班车而烦恼。
本站主要整合如下评职称,发表论文:
教育论文发表
经济论文发表
科技论文发表
医学论文发表
计算机论文发表
文学论文发表
农业论文发表
学报论文发表
其它论文发表等,另期待更多的杂志编辑与本站联系文:
85782530(普刊发表)
82534308(核心发表)共同以正期刊界正刊之气,维护学术良好的氛围。
免责声明:本网所提供的信息资源如有侵权、违规,请及时告知!
论文网版权所有, 本站提供论文发表 论文投稿 发表论文 发表文章
文章只代表作者观点,并不意味着本站认同,部分作品系转载,版权归原作者或相应的机构;若某篇作品侵犯您的权利,请来信告知:lunww@126.com
中国论文网全权所属国际域名:www.lunww.com 中文域名:论文发表 技术支持:论文发表 国家双软认定单位 法律顾问:全民安律师事务所
期刊合作加盟咨询:5715378(加盟、投诉、建议) 论文发表咨询电话:18262951856 论文发表投稿邮箱:lunww@126.com
Powered by 论文发表 © 2010-2020

苏ICP备19023845号-4